#Data cleansing
Explore tagged Tumblr posts
Text
Smooth Transitions: Ensuring Reliable Data Migration with PiLog
In the era of digital transformation, organizations are constantly evolving—upgrading systems, consolidating databases, and moving to the cloud. At the core of these initiatives lies a critical challenge: data migration. Without proper strategy and execution, data migration can lead to data loss, downtime, or costly errors. That’s where PiLog delivers value.
What Is Data Migration?
Data migration is the process of transferring data between storage types, formats, or systems. It typically happens during system upgrades, ERP implementations, mergers and acquisitions, or cloud adoption. Although it sounds straightforward, data migration is a high-stakes operation that demands accuracy, security, and minimal disruption to business operations.
Why PiLog for Data Migration?
At PiLog, we recognize that migrating data isn't just about "moving" information—it's about transforming it into a clean, structured, and usable form that enhances business decision-making. Our methodology combines automation, standardization, and quality management to ensure that migrated data is reliable, compliant, and business-ready.
Our Proven Approach:
Data Assessment & Planning We begin with a thorough analysis of the source data to detect gaps, inconsistencies, and redundancies.
Data Cleansing & Standardization Using PiLog’s tools and ISO 8000-compliant templates, we cleanse and standardize data before migration, ensuring consistency across systems.
Classification & Enrichment We enhance data by applying accurate taxonomy and enriching it with
business-relevant attributes.
Automated Migration & Validation With the help of our smart APIs and microservices, we automate the data migration process while ensuring each data point is validated.
Post-Migration Quality Checks After migration, we run quality checks and audits to confirm data completeness, accuracy, and integrity.
Real-Time Integration with ERP Systems
PiLog’s data migration services are compatible with leading ERP platforms like SAP, Oracle, and Microsoft Dynamics, enabling seamless, real-time integration. Our clients benefit from uninterrupted workflows and a smooth transition to their new environments.
0 notes
Text
AI Costs Are Accelerating — Here’s How to Keep Them Under Control
New Post has been published on https://thedigitalinsider.com/ai-costs-are-accelerating-heres-how-to-keep-them-under-control/
AI Costs Are Accelerating — Here’s How to Keep Them Under Control


Cloud usage continues to soar, as do its associated costs — particularly, of late, those driven by AI. Gartner analysts predict worldwide end-user spending on public cloud services will swell to $723.4 billion in 2025, up from just under $600 billion in 2024. And 70% of executives surveyed in an IBM report cited generative AI as a critical driver of this increase.
At the same time, China’s DeepSeek made waves when it claimed it took just two months and $6 million to train its AI model. There’s some doubt whether those figures tell the whole story, but if Microsoft and Nvidia’s still-jolted share prices are any indication, the announcement woke the Western world up to the need for cost-efficient AI systems.
To date, companies have been able to treat mounting AI costs as R&D write-offs. But AI costs — especially those associated with successful products and features — will eventually hit companies’ cost of goods sold (COGS) and, consequently, their gross margins. AI innovations were always destined to face the cold scrutiny of business sense; DeepSeek’s bombshell announcement just shortened that timeline.
Just like they do with the rest of the public cloud, companies will need to manage their AI costs, including both training and consumption costs. They’ll need to connect AI spending with business outcomes, optimize AI infrastructure costs, refine pricing and packaging strategies, and maximize the return on their AI investments.
How can they do it? With cloud unit economics (CUE).
What is cloud unit economics (CUE)?
CUE comprises the measurement and maximization of cloud-driven profit. Its fundamental mechanism is connecting cloud cost data with customer demand and revenue data, revealing the most and least profitable dimensions of a business and thus showing companies how and where to optimize. CUE applies across all sources of cloud spending, including AI costs.
The foundation of CUE is cost allocation — organizing cloud costs according to who and/or what drives them. Common allocation dimensions include cost per customer, cost per engineering team, cost per product, cost per feature, and cost per microservice. Companies using a modern cost management platform often allocate costs in a framework that mirrors their business structure (their engineering hierarchy, platform infrastructure, etc.).
Then, the heart of CUE is the unit cost metric, which compares cost data with demand data to show a company their all-in cost to serve. For example, a B2B marketing company might want to calculate its “cost per 1,000 messages” sent via its platform. To do this, it would have to track its cloud costs and the number of messages sent, feed that data into a single system, and instruct that system to divide its cloud costs by its messages and graph the result in a dashboard.
Since the company started with cost allocation, it could then view its cost per 1,000 messages by customer, product, feature, team, microservice, or whatever other view it deemed reflective of its business structure.
The results:
Flexible business dimensions by which they can filter their unit cost metric, showing them which areas of their business are driving their cloud costs
An illuminating unit cost metric that shows them how efficiently they’re meeting customer demand
The ability to make targeted efficiency improvements, like refactoring infrastructure, tweaking customer contracts, or refining pricing and packaging models
CUE in the AI age
In the CUE model, AI costs are just one more source of cloud spending that can be incorporated into a business’s allocation framework. The way that AI companies disseminate cost data is still evolving, but in principle, cost management platforms treat AI costs in much the same way as they treat AWS, Azure, GCP, and SaaS costs.
Modern cloud cost management platforms allocate AI costs and show their efficiency impact in the context of unit cost metrics.
Companies should allocate their AI costs in a handful of intuitive ways. One would be the aforementioned cost per team, an allocation dimension common to all sources of cloud spending, showing the costs that each engineering team is responsible for. This is particularly useful because leaders know exactly who to notify and hold accountable when a particular team’s costs spike.
Companies might also want to know their cost per AI service type — machine learning (ML) models versus foundation models versus third-party models like OpenAI. Or, they could calculate their cost per SDLC stage to understand how an AI-powered feature’s costs change as it transitions from development to testing to staging and finally to production. A company could get even more granular and calculate its cost per AI development lifecycle stage, including data cleansing, storage, model creation, model training, and inference.
Zooming out from the weeds a bit: CUE means comparing organized cloud cost data with customer demand data and then figuring out where to optimize. AI costs are just one more source of cloud cost data that, with the right platform, fit seamlessly into a company’s overall CUE strategy.
Avoiding the COGS tsunami
As of 2024, only 61% of companies had formalized cloud cost management systems in place (per a CloudZero survey). Unmanaged cloud costs soon become unmanageable: 31% of companies — similar to the portion who don’t formally manage their costs — suffer major COGS hits, reporting that cloud costs consume 11% or more of their revenue. Unmanaged AI costs will only exacerbate this trend.
Today’s most forward-thinking organizations treat cloud costs like any other major expenditure, calculating its ROI, breaking that ROI down by their most critical business dimensions, and empowering the relevant team members with the data needed to optimize that ROI. Next-generation cloud cost management platforms offer a comprehensive CUE workflow, helping companies avoid the COGS tsunami and bolster long-term viability.
#000#2024#2025#ai#AI costs#AI development#AI Infrastructure#ai model#AI systems#AI-powered#amp#AWS#azure#B2B#billion#Business#change#China#Cloud#cloud services#cloud spending#CloudZero#Companies#comprehensive#Cost-efficient AI#dashboard#data#data cleansing#deepseek#development
0 notes
Text

CRM Data Enrichment and cleansing service
Optimize your business with Apeiro Solutions database management & Administration Services. Include data validation, enrichment, and cleansing to keep your CRM accurate and efficient.
#Data Cleansing#data enrichment#data validation#Data cleansing services#Data enrichment services#Data processing services
0 notes
Text
Efficient data cleansing is crucial for accurate AI model training. This 5-step data cleansing checklist ensures your financial datasets are free of errors, inconsistencies, and duplicates. Learn how to handle missing data, standardize formats, and validate datasets for seamless AI integration. Strengthen your data strategy with a structured approach to finance data preparation and enhance AI performance.
0 notes
Text
A Beginner’s Guide to Data Cleaning Techniques

Data is the lifeblood of any modern organization. However, raw data is rarely ready for analysis. Before it can be used for insights, data must be cleaned, refined, and structured—a process known as data cleaning. This blog will explore essential data-cleaning techniques, why they are important, and how beginners can master them.
#data cleaning techniques#data cleansing#data scrubbing#business intelligence#Data Cleaning Challenges#Removing Duplicate Records#Handling Missing Data#Correcting Inconsistencies#Python#pandas#R#OpenRefine#Microsoft Excel#Tools for Data Cleaning#data cleaning steps#dplyr and tidyr#basic data cleaning features#Data validation
0 notes
Text

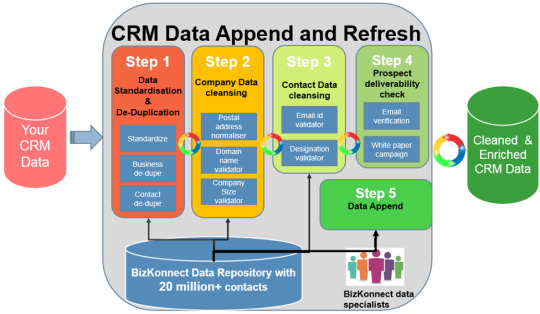
6 Essential Steps for Effective CRM Data Cleansing
Successful data entry outsourcing involves selecting a reliable provider, ensuring clear communication, and establishing robust quality control measures. Prioritize vendors with proven expertise, solid references, and data security protocols. Define clear guidelines and expectations upfront, and maintain regular check-ins to monitor progress. Use detailed training materials to ensure consistency and accuracy. Lastly, employ a mix of automated and manual quality checks to verify data integrity and address any discrepancies promptly. Visit: https://www.acelerartech.com/blog/effective-crm-data-cleansing-steps/
0 notes
Text
Major Political Shift in Indian General Election, Jeopardizing Modi's Historic Third Term
June 5, 2024 The recent Indian general election has resulted in a significant political shift, with Prime Minister Narendra Modi’s Bharatiya Janata Party (BJP) experiencing major losses. Despite Modi’s claim of victory for a historic third term, the BJP is projected to lose its majority in Parliament, which is considered a substantial setback for the party that was long expected to secure a full…

View On WordPress
#AI News#Bharatiya Janata Party#bjp#campaigning#data cleansing#debate and content analysis#election monitoring#election security#engagement#ethical AI#logistics and resource management#narendra modi#News#polling and surveys#predictive analytics#third term#verification#voter education#voter registration
0 notes
Text
Data Cleansing Techniques for Various Businesses

Data cleansing services is a process of extracting bad data from a large dataset and enhances the quality of information which can be further used for a variety of purposes and streamline the operations of the business.
Checkout the effective techniques for data cleansing services for a variety of industries.
#data cleansing services#data cleansing process#crm data cleansing services#data cleaning services#data management services#data cleansing#data cleaning#outsourcing data cleansing#data entry services#data digitization services
1 note
·
View note
Text
Selecting the Optimal Data Quality Management Solution for Your Business
In today's data-centric business environment, ensuring the accuracy, consistency, and reliability of data is paramount. An effective Data Quality Management (DQM) solution not only enhances decision-making but also drives operational efficiency and compliance. PiLog Group emphasizes a structured approach to DQM, focusing on automation, standardization, and integration to maintain high-quality data across the enterprise.
Key Features to Consider in a DQM Solution
Automated Data Profiling and Cleansing Efficient DQM tools should offer automated profiling to assess data completeness and consistency. PiLog's solutions utilize Auto Structured Algorithms (ASA) to standardize and cleanse unstructured data, ensuring data integrity across systems.
Standardization and Enrichment Implementing standardized data formats and enriching datasets with relevant
information enhances usability. PiLog provides preconfigured templates and ISO 8000-compliant records to facilitate this process.
Integration Capabilities A robust DQM solution should seamlessly integrate with existing IT infrastructures. PiLog's micro-services (APIs) support real-time data cleansing, harmonization, validation, and enrichment, ensuring compatibility with various systems.
Real-Time Monitoring and Reporting Continuous monitoring of data quality metrics allows for proactive issue resolution. PiLog offers dashboards and reports that provide insights into data quality assessments and progress.
User-Friendly Interface and Customization An intuitive interface with customization options ensures that the DQM tool aligns with specific business processes, enhancing user adoption and effectiveness.
Implementing PiLog's DQM Strategy
PiLog's approach to DQM involves:
Analyzing source data for completeness, consistency, and redundancy.
Auto-assigning classifications and characteristics using PiLog's taxonomy.
Extracting and validating key data elements from source descriptions.
Providing tools for bulk review and quality assessment of materials.
Facilitating real-time integration with other systems for seamless data migration. piloggroup.com+1piloggroup.com+1
By focusing on these aspects, PiLog ensures that businesses can maintain high-quality data, leading to improved decision-making and operational efficiency.
0 notes
Text
[Python] PySpark to M, SQL or Pandas
Hace tiempo escribí un artículo sobre como escribir en pandas algunos códigos de referencia de SQL o M (power query). Si bien en su momento fue de gran utilidad, lo cierto es que hoy existe otro lenguaje que representa un fuerte pie en el análisis de datos.
Spark se convirtió en el jugar principal para lectura de datos en Lakes. Aunque sea cierto que existe SparkSQL, no quise dejar de traer estas analogías de código entre PySpark, M, SQL y Pandas para quienes estén familiarizados con un lenguaje, puedan ver como realizar una acción con el otro.
Lo primero es ponernos de acuerdo en la lectura del post.
Power Query corre en capas. Cada linea llama a la anterior (que devuelve una tabla) generando esta perspectiva o visión en capas. Por ello cuando leamos en el código #“Paso anterior” hablamos de una tabla.
En Python, asumiremos a "df" como un pandas dataframe (pandas.DataFrame) ya cargado y a "spark_frame" a un frame de pyspark cargado (spark.read)
Conozcamos los ejemplos que serán listados en el siguiente orden: SQL, PySpark, Pandas, Power Query.
En SQL:
SELECT TOP 5 * FROM table
En PySpark
spark_frame.limit(5)
En Pandas:
df.head()
En Power Query:
Table.FirstN(#"Paso Anterior",5)
Contar filas
SELECT COUNT(*) FROM table1
spark_frame.count()
df.shape()
Table.RowCount(#"Paso Anterior")
Seleccionar filas
SELECT column1, column2 FROM table1
spark_frame.select("column1", "column2")
df[["column1", "column2"]]
#"Paso Anterior"[[Columna1],[Columna2]] O podría ser: Table.SelectColumns(#"Paso Anterior", {"Columna1", "Columna2"} )
Filtrar filas
SELECT column1, column2 FROM table1 WHERE column1 = 2
spark_frame.filter("column1 = 2") # OR spark_frame.filter(spark_frame['column1'] == 2)
df[['column1', 'column2']].loc[df['column1'] == 2]
Table.SelectRows(#"Paso Anterior", each [column1] == 2 )
Varios filtros de filas
SELECT * FROM table1 WHERE column1 > 1 AND column2 < 25
spark_frame.filter((spark_frame['column1'] > 1) & (spark_frame['column2'] < 25)) O con operadores OR y NOT spark_frame.filter((spark_frame['column1'] > 1) | ~(spark_frame['column2'] < 25))
df.loc[(df['column1'] > 1) & (df['column2'] < 25)] O con operadores OR y NOT df.loc[(df['column1'] > 1) | ~(df['column2'] < 25)]
Table.SelectRows(#"Paso Anterior", each [column1] > 1 and column2 < 25 ) O con operadores OR y NOT Table.SelectRows(#"Paso Anterior", each [column1] > 1 or not ([column1] < 25 ) )
Filtros con operadores complejos
SELECT * FROM table1 WHERE column1 BETWEEN 1 and 5 AND column2 IN (20,30,40,50) AND column3 LIKE '%arcelona%'
from pyspark.sql.functions import col spark_frame.filter( (col('column1').between(1, 5)) & (col('column2').isin(20, 30, 40, 50)) & (col('column3').like('%arcelona%')) ) # O spark_frame.where( (col('column1').between(1, 5)) & (col('column2').isin(20, 30, 40, 50)) & (col('column3').contains('arcelona')) )
df.loc[(df['colum1'].between(1,5)) & (df['column2'].isin([20,30,40,50])) & (df['column3'].str.contains('arcelona'))]
Table.SelectRows(#"Paso Anterior", each ([column1] > 1 and [column1] < 5) and List.Contains({20,30,40,50}, [column2]) and Text.Contains([column3], "arcelona") )
Join tables
SELECT t1.column1, t2.column1 FROM table1 t1 LEFT JOIN table2 t2 ON t1.column_id = t2.column_id
Sería correcto cambiar el alias de columnas de mismo nombre así:
spark_frame1.join(spark_frame2, spark_frame1["column_id"] == spark_frame2["column_id"], "left").select(spark_frame1["column1"].alias("column1_df1"), spark_frame2["column1"].alias("column1_df2"))
Hay dos funciones que pueden ayudarnos en este proceso merge y join.
df_joined = df1.merge(df2, left_on='lkey', right_on='rkey', how='left') df_joined = df1.join(df2, on='column_id', how='left')Luego seleccionamos dos columnas df_joined.loc[['column1_df1', 'column1_df2']]
En Power Query vamos a ir eligiendo una columna de antemano y luego añadiendo la segunda.
#"Origen" = #"Paso Anterior"[[column1_t1]] #"Paso Join" = Table.NestedJoin(#"Origen", {"column_t1_id"}, table2, {"column_t2_id"}, "Prefijo", JoinKind.LeftOuter) #"Expansion" = Table.ExpandTableColumn(#"Paso Join", "Prefijo", {"column1_t2"}, {"Prefijo_column1_t2"})
Group By
SELECT column1, count(*) FROM table1 GROUP BY column1
from pyspark.sql.functions import count spark_frame.groupBy("column1").agg(count("*").alias("count"))
df.groupby('column1')['column1'].count()
Table.Group(#"Paso Anterior", {"column1"}, {{"Alias de count", each Table.RowCount(_), type number}})
Filtrando un agrupado
SELECT store, sum(sales) FROM table1 GROUP BY store HAVING sum(sales) > 1000
from pyspark.sql.functions import sum as spark_sum spark_frame.groupBy("store").agg(spark_sum("sales").alias("total_sales")).filter("total_sales > 1000")
df_grouped = df.groupby('store')['sales'].sum() df_grouped.loc[df_grouped > 1000]
#”Grouping” = Table.Group(#"Paso Anterior", {"store"}, {{"Alias de sum", each List.Sum([sales]), type number}}) #"Final" = Table.SelectRows( #"Grouping" , each [Alias de sum] > 1000 )
Ordenar descendente por columna
SELECT * FROM table1 ORDER BY column1 DESC
spark_frame.orderBy("column1", ascending=False)
df.sort_values(by=['column1'], ascending=False)
Table.Sort(#"Paso Anterior",{{"column1", Order.Descending}})
Unir una tabla con otra de la misma característica
SELECT * FROM table1 UNION SELECT * FROM table2
spark_frame1.union(spark_frame2)
En Pandas tenemos dos opciones conocidas, la función append y concat.
df.append(df2) pd.concat([df1, df2])
Table.Combine({table1, table2})
Transformaciones
Las siguientes transformaciones son directamente entre PySpark, Pandas y Power Query puesto que no son tan comunes en un lenguaje de consulta como SQL. Puede que su resultado no sea idéntico pero si similar para el caso a resolver.
Analizar el contenido de una tabla
spark_frame.summary()
df.describe()
Table.Profile(#"Paso Anterior")
Chequear valores únicos de las columnas
spark_frame.groupBy("column1").count().show()
df.value_counts("columna1")
Table.Profile(#"Paso Anterior")[[Column],[DistinctCount]]
Generar Tabla de prueba con datos cargados a mano
spark_frame = spark.createDataFrame([(1, "Boris Yeltsin"), (2, "Mikhail Gorbachev")], inferSchema=True)
df = pd.DataFrame([[1,2],["Boris Yeltsin", "Mikhail Gorbachev"]], columns=["CustomerID", "Name"])
Table.FromRecords({[CustomerID = 1, Name = "Bob", Phone = "123-4567"]})
Quitar una columna
spark_frame.drop("column1")
df.drop(columns=['column1']) df.drop(['column1'], axis=1)
Table.RemoveColumns(#"Paso Anterior",{"column1"})
Aplicar transformaciones sobre una columna
spark_frame.withColumn("column1", col("column1") + 1)
df.apply(lambda x : x['column1'] + 1 , axis = 1)
Table.TransformColumns(#"Paso Anterior", {{"column1", each _ + 1, type number}})
Hemos terminado el largo camino de consultas y transformaciones que nos ayudarían a tener un mejor tiempo a puro código con PySpark, SQL, Pandas y Power Query para que conociendo uno sepamos usar el otro.
#spark#pyspark#python#pandas#sql#power query#powerquery#notebooks#ladataweb#data engineering#data wrangling#data cleansing
0 notes
Text
Data cleansing is an on-going process that starts with detecting flaws, fixing them, and preventing errors, duplicates, and imperfections in a database. Since it’s a process, the data cleansing experts follow a well-defined strategy that targets achieving accuracy, reliability, and consistency. With these qualities, the data becomes useful. Its clean structure helps in getting deep into insights, preparing exact reports, and making decisions that actually prove helpful and actionable.
#data management#data cleansing#data services#data cleansing solutions#business#technology#data#services#Data cleansing benefits
0 notes
Text

Why Data Cleansing Matters for Your Business
Data cleansing is crucial for business success. It ensures accuracy, reliability, and relevance of information, enhancing decision-making and strategic planning. By eliminating inconsistencies, errors, and duplicates, businesses can trust their data for analysis and forecasting. Clean data fosters customer satisfaction, operational efficiency, and regulatory compliance, minimizing risks and maximizing opportunities. In today's data-driven landscape, investing in data cleansing safeguards reputation and fosters growth, making it an indispensable practice for any forward-thinking organization. Visit: https://www.acelerartech.com/blog/why-data-cleansing-matters-for-your-business/
0 notes
Text

Managing a CRM system demands a keen eye for detail. That’s why the ability to ensure data accuracy is crucial. So, regularly auditing and cleaning your CRM prevents redundant or obsolete entries, maintaining its relevance.
#org charts#account maps#actionable sales intelligence#crm data cleansing#CRM enrichment#data cleansing
0 notes
Text
Discover the power of data with in2in global's Data Insights services. Our expert team delivers comprehensive and actionable insights to help your business thrive.
#data science#data cleansing#data visualization#data analytics#data#data analysis#data processing#datainsights#data profiling
0 notes